Running digital marketing campaigns without tracking the right numbers makes it difficult to know what is working and where money is being wasted. In this guide, you will learn 20 important digital marketing KPIs, where to find each metric, how to calculate or track it, and why it matters to your business.
1. Website Traffic
Website traffic measures how many people visit your website from different sources, such as Google, social media, paid ads, email, and referral links.
Why should you track it?
It helps you understand whether your marketing activities are bringing people to your website. It also shows which channels attract visitors and which campaigns need improvement. More traffic is not always better. You need to check whether those visitors are relevant to your business.
Where to track it: Google Analytics 4 (GA4).
How to track it:
1. Open Google Analytics and select your website property.
2. Go to Reports → Acquisition → Traffic acquisition.
3. Set the date range you want to analyse.
4. Review the Sessions column to see how many visits your website received.
5. Check Session default channel group to compare Organic Search, Paid Search, Direct, Organic Social, Referral, and other channels.
6. Compare the current period with the previous period to identify traffic growth or decline.
Use sessions to measure visits and active users to understand how many engaged visitors came to your website. Do not treat these two metrics as the same.
2. Website Users and New Users
Sessions tell you how many visits your website received. Users tell you how many individual people visited during the selected period. New users show how many people visited your website for the first time, according to Analytics.
Why should you track it?
This metric helps you understand whether your marketing is reaching new people or mainly bringing back existing visitors. If sessions increase but new users remain flat, returning visitors may be driving much of the growth.
Where to track it: Google Analytics 4.
How to track it:
1. Open GA4 and select your website property.
2. Go to Reports → Acquisition → User acquisition.
3. Set the date range.
4. Find Total users and New users in the report.
5. Compare the figures with the previous period.
6. Check the First user default channel group dimension to see which channel first brought users to your website.
7. Record the results monthly to identify whether your campaigns are attracting new audiences.
Remember that GA4's User acquisition report focuses on how new users first found you. Traffic acquisition focuses on the source of each session. They answer different questions.
3. Traffic by Marketing Channel
Total traffic tells you how many visits you received. Traffic by channel tells you where those visits came from. This distinction helps you identify which marketing activities are bringing visitors to your website.
Why should you track it?
Suppose your website receives 5,000 sessions in a month. You need to know whether those sessions came from Google organic search, paid advertising, social media, email, or referral websites. Otherwise, you cannot identify which channel deserves more attention or budget.
Where to track it: GA4 Traffic acquisition report.
How to track it:
1. Open Reports → Acquisition → Traffic acquisition.
2. Select the date range.
3. Find the Session default channel group column.
4. Review the sessions attributed to Organic Search, Paid Search, Organic Social, Paid Social, Email, Direct, and Referral.
5. Add the Sessions, Engaged sessions, and Key events metrics if they are not already visible.
6. Compare the channels to see which ones bring traffic and which ones generate meaningful actions.
7. Export the report if you need to prepare a monthly channel performance sheet.
For example, if Organic Search brings 2,000 sessions and Paid Social brings 1,000, that does not automatically mean SEO is performing better. Compare leads, purchases, and cost as well.
4. Engagement Rate
Engagement rate measures the percentage of website sessions in which visitors actively engaged with your website. In GA4, a session is considered engaged if it lasts longer than 10 seconds, includes a key event, or has at least two page or screen views.
Why should you track it?
It helps you understand whether visitors are interacting with your website after arriving. If a campaign brings plenty of traffic but engagement remains low, check whether the ad message matches the landing page and whether the page gives visitors what they expected.
Where to track it: GA4.
How to track it:
1. Open Reports → Acquisition → Traffic acquisition.
2. Select your reporting period.
3. Find the Engagement rate column.
4. Compare engagement rates across Organic Search, Paid Search, Social, Email, and other channels.
5. Click or filter a channel to investigate its performance.
6. Check the landing pages receiving low engagement.
7. Review the page content, loading speed, mobile layout, and call to action.
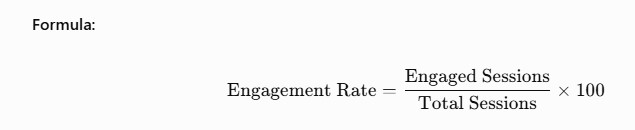
For example, if your website receives 1,000 sessions and 650 are engaged, the engagement rate is 65%.
5. Bounce Rate
Bounce rate in GA4 is the percentage of sessions that were not engaged. It is the opposite of engagement rate.
Why should you track it?
A high bounce rate can indicate that visitors are not finding what they expected or are not interacting with the page. It is useful for identifying pages that may need better content, clearer navigation, or a stronger next step.
Do not assume every high bounce rate is a problem. Someone who reads a complete contact number or gets an answer from a single page may leave without needing another interaction.
Where to track it: GA4.
How to track it:
1. Open Reports → Engagement → Pages and screens.
2. Check whether the Bounce rate column is available.
3. If it is missing, customise the report and add Bounce rate.
4. Review the bounce rate for individual landing pages.
5. Compare it with the traffic source and device category.
6. Open pages with unusually high bounce rates and check whether the content matches the search query or ad promise.
7. Test the page on mobile and desktop, including its forms and buttons.
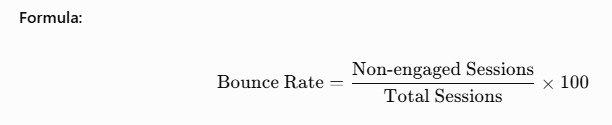
A 70% bounce rate means 70 out of every 100 sessions were not classified as engaged in GA4. It does not automatically mean 70% of visitors disliked the page.
6. Search Impressions
Search impressions measure how often your website's content appeared in Google Search results. An impression does not mean someone clicked your website. It means your result was shown according to Google's impression counting rules.
Why should you track it?
Impressions help you understand whether your website is gaining visibility for relevant search queries. If impressions increase but clicks do not, your pages may be appearing more often without attracting enough attention.
Where to track it: Google Search Console.
How to track it:
1. Open Google Search Console.
2. Select your website property.
3. Go to Performance → Search results.
4. Select the date range, such as the last three months.
5. Tick the Total impressions box.
6. Open the Queries tab to see which search terms are showing your website.
7. Open the Pages tab to identify which URLs are receiving impressions.
8. Compare the current period with the previous period.
For example, if a blog's impressions increase from 2,000 to 8,000 but clicks remain almost the same, investigate its average position, title, description, and search intent.
7. Organic Search Clicks
Organic clicks measure how many times people clicked your website's unpaid listing in Google Search results.
Why should you track it?
This metric shows whether your SEO work is bringing visitors from Google. It helps you evaluate the impact of keyword targeting, content improvements, technical SEO, and search visibility.
Where to track it: Google Search Console.
How to track it:
1. Open Search Console.
2. Select Performance → Search results.
3. Choose the date range you want to review.
4. Tick the Total clicks metric.
5. Open the Queries tab to identify keywords bringing clicks.
6. Open the Pages tab to find your highest-traffic organic pages.
7. Compare clicks month over month and year over year where possible.
8. Investigate pages that have lost clicks and check for changes in impressions, position, and search intent.
Do not depend only on total organic clicks. Check which pages and queries generate enquiries, purchases, or other business results.
8. Click-Through Rate (CTR)
CTR measures the percentage of impressions that resulted in clicks. It helps you understand how effectively your search result or advertisement encourages people to visit your website.
Why should you track it?
A page can receive thousands of impressions but very few clicks. This may happen because the title is unclear, the description does not match the search intent, or competing results look more relevant.
Where to track it:
- Organic search: Google Search Console.
- Paid search: Google Ads.
- Paid social: Meta Ads Manager.
How to track organic CTR:
1. Open Search Console.
2. Go to Performance → Search results.
3. Tick Total impressions, Total clicks, and Average CTR.
4. Select the Pages tab.
5. Identify pages with high impressions but low CTR.
6. Open the Queries tab and check which searches trigger those pages.
7. Review the page title and meta description.
8. Improve them so they clearly explain what the visitor will find. Avoid making promises the page does not fulfil.

For example, 100 clicks from 5,000 impressions gives a CTR of 2%.
Google Search Console calculates CTR using clicks divided by impressions. Search CTR and advertising CTR should be analysed separately because they come from different types of results.
9. Average Search Position
Average position shows the average position of your website's topmost result for the searches where it appeared. It is not a fixed ranking for one keyword.
Why should you track it?
It helps you understand whether your website is gaining or losing visibility for the queries that matter to your business. It is especially useful when monitoring SEO improvements over time.
Where to track it: Google Search Console.
How to track it:
1. Open Performance → Search results in Search Console.
2. Select the Average position metric.
3. Open the Queries tab.
4. Find your important target keywords.
5. Click a keyword to filter the report for that query.
6. Review the average position and compare it with an earlier date range.
7. Open the Pages tab to see which page is ranking for that query.
8. Check whether the correct page is appearing and whether its content matches the search intent.
For example, if a keyword's average position changes from 18 to 10, it indicates improved average visibility. It does not mean the page will appear at position 10 for every user or location.
Google explains that average position is calculated across impressions and can vary depending on the query and search result layout.
10. Conversion Rate
Conversion rate measures the percentage of visitors or sessions that complete an important action on your website. That action could be submitting an enquiry form, making a purchase, booking an appointment, or requesting a quotation.
Why should you track it?
Traffic alone does not tell you whether your marketing is generating business. Conversion rate shows how effectively your website turns visitors into potential customers or paying customers.
Where to track it: GA4.
How to track it:
1. First, decide what counts as a conversion for your business. For a service company, it could be a successful enquiry form submission. For an online store, it could be a purchase.
2. Make sure the relevant event is being recorded in GA4. For example, use a generate_lead event for a lead generation action or a purchase event for an online sale.
3. Open Admin → Events and check whether the event is being received.
4. Mark the important event as a Key event if it is not already marked.
5. Go to Reports → Engagement → Events and check the event count.
6. Open Reports → Acquisition → Traffic acquisition to compare the session key event rate across channels.
7. Test the form or purchase process yourself to confirm that the event fires only when the action is successfully completed.

For example, if 2,000 sessions generate 80 successful enquiries, the session based conversion rate is 4%.
Be consistent about the denominator. A conversion rate calculated using sessions is different from one calculated using users.
11. Lead Volume
Lead volume is the total number of potential customers who contact your business through marketing channels. Leads may come through website forms, phone calls, WhatsApp, landing pages, social media forms, or other enquiry methods.
Why should you track it?
It tells you whether your marketing campaigns are generating enough potential customers for the sales team. It also helps you compare lead generation across channels and campaigns.
Where to track it:
- CRM software, such as HubSpot or Zoho CRM.
- GA4 for website lead events.
- Google Ads and Meta Ads Manager for platform attributed leads.
- Your lead form or call tracking system.
How to track it:
1. Decide what qualifies as a lead. For example, a completed enquiry form with valid contact details.
2. Make sure every lead source is recorded. Use campaign tracking parameters such as UTM tags for external campaign links.
3. Connect website forms to your CRM or lead management system.
4. Record the lead's name, contact details, source, campaign, date, and status.
5. Check the CRM regularly and remove test submissions, duplicates, and spam.
6. Create a monthly report showing total leads by source and campaign.
7. Compare the number of leads with the number of qualified leads and customers.
For example, if Google Ads generates 120 leads and organic search generates 45, do not decide that Google Ads is automatically better. Check how many of those leads are relevant and how many become customers.
12. Cost Per Lead (CPL)
Cost per lead tells you how much money you spend to generate one lead through a marketing campaign.
Why should you track it?
It helps you understand whether your lead generation campaigns are using their budget efficiently. If the cost per lead increases, you can investigate whether the problem comes from advertising costs, poor targeting, weak creatives, or low landing page conversion.
Where to track it:
- Google Ads for Google advertising campaigns.
- Meta Ads Manager for Facebook and Instagram campaigns.
- Your CRM for a more complete view of leads from different sources.
How to track it:
1. Open Google Ads or Meta Ads Manager.
2. Select the campaign you want to analyse.
3. Set the reporting period.
4. Check the total amount spent.
5. Add or review the Leads or Results column, depending on your campaign objective and reporting setup.
6. Calculate the cost using the campaign spend and valid leads received.
7. Compare CPL across campaigns, audiences, locations, and creatives.
8. Verify the lead count against your CRM to remove duplicate, spam, or invalid submissions.

For example, if you spend ₹10,000 and generate 50 valid leads, your CPL is ₹200.
Do not compare CPL without checking lead quality. A campaign generating leads at ₹100 each may be less valuable than one generating leads at ₹250 each if the second campaign brings more customers.
13. Customer Acquisition Cost (CAC)
Customer Acquisition Cost measures how much your business spends to acquire one new paying customer. Unlike CPL, CAC considers customers who actually purchase, not just people who enquire.
Why should you track it?
A campaign may generate many leads, but only a few may become customers. CAC helps you understand the actual cost of acquiring business and whether your marketing investment is commercially sustainable.
Where to track it:
- CRM software for new customers and sales records.
- Google Ads and Meta Ads Manager for advertising spend.
- Accounting or finance software for other acquisition costs.
- A spreadsheet or reporting dashboard to combine the figures.
How to track it:
1. Choose a reporting period, such as one month or one quarter.
2. Record the total marketing and sales acquisition costs for that period.
3. Include the costs you have decided to count, such as ad spend, agency fees, marketing tools, and sales team costs.
4. Count the new customers acquired during the same period.
5. Divide the total acquisition cost by the number of new customers.
6. Compare CAC across channels if you have reliable source attribution.
7. Review the result alongside customer revenue and profit.

For example, if your business spends ₹60,000 on customer acquisition and gains 20 new customers, your CAC is ₹3,000.
Use a consistent cost definition. If you calculate CAC using advertising spend alone, label it as paid media CAC rather than presenting it as the full business CAC.
14. Paid Advertising Click-Through Rate
Paid advertising CTR measures the percentage of ad impressions that result in clicks. It helps you understand whether your advertisement attracts attention from the audience seeing it.
Why should you track it?
If people see your advertisement but do not click, the creative, headline, offer, audience, or message may not be relevant enough. CTR helps you identify ads that need improvement.
Where to track it:
- Google Ads.
- Meta Ads Manager.
How to track it in Google Ads:
1. Open your Google Ads account.
2. Select Campaigns from the left navigation.
3. Choose the campaign and date range.
4. Find the CTR column.
5. If it is not visible, click Columns → Modify columns and add CTR.
6. Compare CTR across campaigns, ad groups, keywords, and individual ads.
7. Review search terms and ad relevance before making changes.
How to track it in Meta Ads Manager:
1. Open Ads Manager.
2. Select the campaign, ad set, or ad.
3. Choose the reporting date range.
4. Click Columns → Customize columns.
5. Add CTR (link click-through rate).
6. Compare ads using the same CTR definition and placement where possible.

For example, if an ad receives 150 clicks from 10,000 impressions, its CTR is 1.5%.
For website traffic campaigns, pay attention to link CTR rather than relying only on an all-click CTR that may include other interactions.
15. Cost Per Click (CPC)
Cost Per Click tells you the average amount paid for each click on your advertisement.
Why should you track it?
CPC helps you understand how much traffic your advertising budget can generate. If CPC increases, your campaign may become more expensive, leaving less budget for reaching potential customers.
Where to track it:
- Google Ads.
- Meta Ads Manager.
How to track it in Google Ads:
1. Open your Google Ads account.
2. Select Campaigns.
3. Choose the campaign and date range.
4. Find the Avg. CPC column.
5. If it is missing, use Columns → Modify columns to add it.
6. Review CPC at campaign, ad group, keyword, and search term levels.
7. Identify expensive keywords and check whether they generate useful conversions.
How to track it in Meta Ads Manager:
1. Open Ads Manager.
2. Select the campaign or ad set.
3. Click Columns → Customize columns.
4. Add CPC (cost per link click).
5. Compare the CPC of different ads and audiences.
6. Check landing page visits and leads as well. A cheap click is not useful if it does not produce meaningful results.

For example, if you spend ₹5,000 and receive 1,000 clicks, your average CPC is ₹5.
Make sure you compare the same type of click. Google Ads average CPC and Meta cost per link click may use different click definitions.
16. Cost Per Thousand Impressions (CPM)
CPM measures how much you pay to show your advertisement 1,000 times. It is commonly used to evaluate the cost of reaching an audience through display and social advertising.
Why should you track it?
CPM helps you understand how expensive it is to get your advertisement in front of people. If CPM increases, your campaign may be facing higher competition, a limited audience, or changes in placement costs.
Where to track it:
- Meta Ads Manager.
- Google Ads for campaigns and inventory where CPM reporting is available.
How to track it in Meta Ads Manager:
1. Open Ads Manager.
2. Select the campaign or ad set.
3. Choose your reporting date range.
4. Click Columns → Customize columns.
5. Search for and select CPM (cost per 1,000 impressions).
6. Apply the column settings.
7. Compare CPM across audiences, placements, and campaigns.
8. Check frequency and campaign results before deciding whether a high CPM is a problem.

For example, if you spend ₹2,000 and receive 50,000 impressions, your CPM is ₹40.
A low CPM does not guarantee campaign success. Check whether the people seeing your ads match your target audience and whether the campaign is generating the intended outcome.
17. Return on Ad Spend (ROAS)
ROAS measures how much revenue your advertising generates for every rupee spent on ads.
Why should you track it?
It helps you understand whether your paid campaigns are generating enough tracked revenue compared with their advertising cost. It is especially important for e-commerce businesses and companies that can connect sales revenue to advertising campaigns.
Where to track it:
- Google Ads with purchase conversion values configured.
- Meta Ads Manager with accurate purchase value tracking.
- GA4 for website revenue and campaign analysis.
- Your e-commerce platform or CRM to verify actual sales.
How to track it in Google Ads:
1. Open Google Ads.
2. Go to Goals → Conversions → Summary.
3. Check whether your purchase conversion action is recording the correct value and currency.
4. Open Campaigns and select your date range.
5. Use Columns → Modify columns to add Conv. value, Cost, and Conv. value / cost.
6. Review the Conv. value / cost column. This is the reported ROAS ratio.
7. Compare campaign performance and verify the sales data against your order records.

For example, if a campaign generates ₹1,00,000 in tracked revenue from ₹20,000 in ad spend, the ROAS is 5, or 5:1.
This means the campaign generated ₹5 in tracked revenue for every ₹1 spent on advertising. It does not mean the business made ₹5 in profit. Product costs, shipping, salaries, taxes, and other expenses still need to be considered.
18. Marketing-Generated Revenue
Marketing-generated revenue measures the sales value attributed to your marketing activities. It helps connect campaign performance with actual business income rather than stopping at clicks and leads.
Why should you track it?
A campaign can generate traffic and enquiries without producing enough sales. Revenue tracking helps you identify which marketing channels contribute to business income and whether your investment is producing commercial results.
Where to track it:
- GA4 for e-commerce purchase revenue.
- CRM software for sales from leads and enquiries.
- Your billing or accounting system for confirmed revenue.
- Google Ads and Meta Ads Manager for platform-attributed revenue.
How to track it:
1. Decide how your business will define marketing-generated revenue.
2. For an online store, configure GA4 purchase tracking and send the correct transaction value and currency.
3. For a service business, record the original lead source in your CRM.
4. Update each lead when it becomes a customer.
5. Enter the actual sale value, not just the estimated quotation amount.
6. Review revenue by original source, campaign, and reporting period.
7. Compare CRM or accounting records with advertising platform reports.
For example, if your CRM shows that 10 customers came from Google Ads and their confirmed sales total ₹2,50,000, that is the revenue recorded from those customers. Make sure your attribution method is consistent and that you do not count the same sale twice.
19. Email Click Rate
Email click rate measures the percentage of delivered emails that generate at least one tracked click. It helps you understand whether recipients are taking action after receiving your email.
Why should you track it?
A person opening an email does not necessarily mean they are interested in your offer. Click rate gives you a stronger indication that the email content or call to action encouraged the recipient to visit a page, read an article, or explore a product.
Where to track it: Your email marketing platform, such as Mailchimp, Brevo, or HubSpot.
How to track it in Mailchimp:
1. Log in to Mailchimp.
2. Open Campaigns → Email.
3. Select the campaign you want to analyse.
4. Open its report.
5. Find the Click rate and Clicked metrics.
6. Open the link activity section to see which URLs received clicks.
7. Compare different campaigns to identify which subject, content, and call to action generated more engagement.
8. Check unsubscribe rates and conversions alongside clicks.

For example, if 1,000 emails are delivered and 40 recipients click a tracked link, the click rate is 4%.
Do not judge email performance using open rate alone. Privacy features and automated activity can affect open tracking, so clicks and actual conversions are more useful when measuring campaign results.
20. Social Media Engagement Rate
Social media engagement rate measures how actively people interact with your content. Depending on the platform, engagement may include likes, comments, shares, saves, and other interactions.
Why should you track it?
Follower count does not tell you whether people are interested in your content. Engagement rate helps you understand which posts encourage interaction and what type of content connects with your audience.
Where to track it:
- Instagram Insights.
- Facebook Professional Dashboard or Meta Business Suite.
- LinkedIn Page Analytics.
- YouTube Studio.
How to track it on Instagram:
1. Open your professional Instagram account.
2. Go to Professional dashboard → Insights.
3. Select the reporting period.
4. Open the content performance section.
5. Review interactions such as likes, comments, shares, and saves.
6. Select individual posts or reels to compare their performance.
7. Record the engagement and reach figures for each content format.
How to track it on LinkedIn:
1. Open your LinkedIn company page.
2. Select Analytics → Content.
3. Choose the reporting period.
4. Review impressions, clicks, reactions, comments, and reposts.
5. Compare posts to identify which topics and formats generate more interactions.
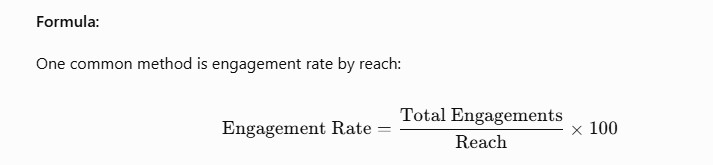
For example, if a post reaches 5,000 people and receives 250 engagements, its engagement rate by reach is 5%.
Different platforms and reporting tools may use different engagement definitions. Always mention whether your calculation is based on reach, impressions, or followers when comparing results.
How to Choose the Right Digital Marketing KPIs for Your Business
You do not need to monitor all 20 metrics with equal attention every day. Choose the metrics that match your business goal.
Marketing goal Important KPIs
Improve SEO Impressions, clicks, CTR, average position
Increase website traffic Sessions, users, traffic by channel
Generate enquiries Conversion rate, lead volume, CPL
Improve paid ads CTR, CPC, CPM, ROAS
Increase sales CAC, marketing-generated revenue, ROAS
Improve social media Engagement rate, reach, interactions
Improve email marketing Click rate, conversions, unsubscribes
A practical reporting routine:
- Daily: Check active campaign spend, leads, and major tracking issues.
- Weekly: Review CTR, CPC, CPL, traffic sources, and campaign conversions.
- Monthly: Analyse organic search performance, CAC, revenue, ROAS, and channel performance.
- Quarterly: Review which channels bring valuable customers and decide where to allocate the next quarter's budget.
Before trusting any KPI, check that tracking is working. A missing GA4 event, duplicate form submission, incorrect purchase value, or broken UTM tag can make a campaign look better or worse than it really is.
How to Measure Your Visibility in AI Search in 2026
Traditional SEO metrics still matter, but people are also discovering businesses through AI-powered search experiences such as Google AI Overviews, ChatGPT, and other generative search tools.
You should monitor this visibility alongside your regular SEO performance.
What to track:
- AI search referral traffic: Visits arriving from identifiable AI platforms.
- AI-driven conversions: Enquiries or purchases from those referral visits.
- Brand mentions: How often your business appears in relevant AI-generated answers.
- Source citations: Whether AI-generated answers link to your website.
- Branded search growth: Whether more people search for your business name after discovering it elsewhere.
How to track it:
1. Open GA4 and review Reports → Acquisition → Traffic acquisition.
2. Look for identifiable AI platform sources in the session source or referral traffic dimensions.
3. Filter those sources and review sessions, key events, and revenue.
4. Use Search Console to monitor organic clicks and impressions. Its reporting includes eligible links shown in AI Overviews under the normal Search performance reporting rules.
5. Manually test relevant questions in different AI search platforms and record whether your brand or website is mentioned and cited.
6. Repeat the checks regularly using the same questions and record changes.
There is no single universal KPI or reliable dashboard that measures your visibility across every AI search platform. Treat AI mentions and citations as additional visibility indicators, not guaranteed ranking measurements.
Conclusion
Digital marketing performance should not be measured by traffic, likes, or clicks alone. You need to understand how those activities contribute to enquiries, customers, revenue, and business growth.
Start by tracking the KPIs connected to your main marketing goals. Use GA4 for website performance, Search Console for organic search, advertising platforms for campaign costs, and your CRM for qualified leads and sales. Review the numbers regularly and make decisions based on actual results rather than assumptions.
If you want to improve your website visibility, generate qualified leads, and make better use of your marketing budget, RankRaze can help. As a digital marketing agency in Chennai, RankRaze provides SEO, paid advertising, content marketing, and performance-focused digital strategies to help businesses grow.